Updated
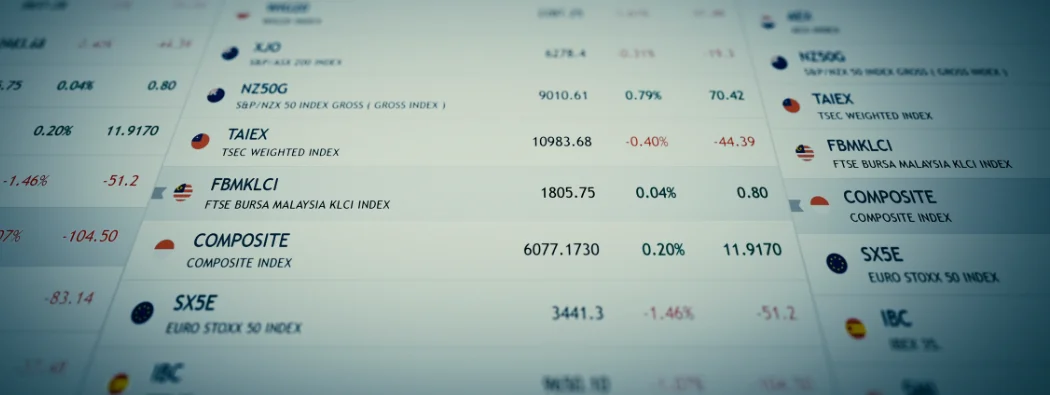
You’ve probably come across the term “stock index” when reading about economics or trading. But what exactly is a stock index? Are there any techniques for trading indices, and what can we learn about them?
Let’s look at the questions below and gain an insight into popular indices trading strategies in this article.
Key Points
- Stock indices track the performance of a group of financial assets and are used by economists and traders to gauge market or sector health.
- Trading indices offers diversification and can be less volatile than individual stocks, providing a broad market exposure with a single trade.
- Popular indices trading strategies include the Bollinger Entry Strategy, Position Trading, Breakout Trading, and End-of-Day Trading, each with distinct entry and exit approaches.
What are Indices?
An index is an instrument that tracks the performance of a group of financial assets. Indices use mathematical formulas to track a specific sector or market [1].
Some broad-based indices seek to imitate a market, while other more specialised indices attempt to capture a particular market niche. Economists, investors, and analysts use them to determine how a specific sector or country’s economy functions.
Popular indices include:
- FTSE100 (Financial Times Stock Exchange 100)
- DAX30
- S&P500 (Standard & Poor’s 500)
- NASDAQ100
Why Trade Indices?
There are several reasons to consider trading indices:
First, stock indices provide immediate diversification, as they comprise a basket of securities. Whenever you purchase a stock index, the movement of that index determines the value of the money put in [2].
When trading stock indices, you don’t just rely on a single company’s success, but on the success of all constituent companies. Unless a firm has a significant weight in the index, poor performance by a single company has a relatively low impact on the index’s price.
For this same reason, stock indices tend to be much less volatile than the price movement of individual company stocks. While some traders view volatility as a way to create trading opportunities, others avoid it due to the heightened risks, making indices an option to consider.

4 Popular Indices CFD Trading Strategies
Here are four trading strategies you may consider using to trade indices:
Bollinger Entry Strategy
The Bollinger entry approach helps you identify oversold target markets and provides optimal market entry levels.
This entry method consists of three bands [3]:
- The middle band represents the index’s simple moving average.
- The upper band represents high market pricing.
- The lower band represents low market pricing.
As a trader, you may use the Bollinger entry method to look for price breakouts above the upper band, which also signals the uptrend’s continuation. This approach helps you enter long trades as soon as the index price breaks above the upper band on the price chart.
You would need to learn the formulas and calculations involved when planning to adopt the Bollinger entry method, because the type of Bollinger band calculation you employ will influence the trading time frame.
Position Trading Strategy
Position trading strategy involves holding an index position for a long time, from several weeks and months to years. It ignores short-term price volatility, providing a more accurate picture of the index’s future trajectory.
You can consider opting for this strategy if you want to create trading opportunities from long-term price movements analysing monthly price charts and placing entry and exit orders accordingly.
To Trade a Long Position:
- When index prices continue to rise for months, it could signal an entry for traders, given the uptrend.
- When index prices begin to decline and continue dropping over a few months or years, it can be perceived as an exit signal due to the projected ongoing downtrend.
Breakout Trading Strategy
The term “breakout trading technique” means recognising a trading range in which the index price has fluctuated over time. A breakout happens when the index price swings outside this range, signalling traders to enter or quit the market [4].
Trading Strategy for the Day’s End
This type of strategy involves trading indices at the market close. End-of-day traders are interested in entering or exiting a market during the last two hours of trading because it gives them a better sense of where index values are forecast to go [5].
This method requires you to track price action from the previous day’s price fluctuations. As an end-of-day trader, you can then speculate on how the price might go based on the price movement and choose which indicators to use in your system.
To reduce potential overnight risk, you may consider employing a risk management strategy that includes putting a limit, stop-loss and take-profit order.
References
- “What Is an Index? Examples, How It’s Used, and How to Invest – Investopedia” https://www.investopedia.com/terms/i/index.asp Accessed 21 Apr 2022
- “Stock Market Index – Corporate Finance Institute” https://corporatefinanceinstitute.com/resources/career-map/sell-side/capital-markets/stock-market-index/ Accessed 21 Apr 2022
- “How to Use Bollinger Bands – Babypips” https://www.babypips.com/learn/forex/bollinger-bands Accessed 21 Apr 2022
- “The Anatomy of Trading Breakouts – Investopedia” https://www.investopedia.com/articles/trading/08/trading-breakouts.asp Accessed 21 Apr 2022
- “End Of Day Trading – Daytrading.com” https://www.daytrading.com/end-of-day-trading Accessed 21 Apr 2022