
 Updated

Imagine a forex trader is watching EUR/USD ahead of a major market session and using the Money Flow Index (MFI) to gauge market strength. Price has been rising for hours and is now close to a key resistance level. At first glance, the uptrend appears strong, and many traders may expect the pair to continue higher.
But the trader checks the Money Flow Index (MFI) and sees that it has moved above 80. This suggests the pair may be overbought or overheating. At the same time, price pushes slightly higher, but the MFI starts to turn down. That may suggest to the trader that buying pressure is fading, even though the price is still rising.
Instead of jumping into a late buy trade, the trader waits. In this example, the pair fails to break resistance and pulls back — illustrating how some traders may use the MFI to assess market conditions, including potential changes in momentum.
In this guide, you will learn.
- What MFI is all about
- Why it matters
- How traders use MFI in trading
- Its comparison with RSI (another momentum indicator)
- How it’s been calculated
- How to read the MFI when trading
- Benefits and limitations.

What is the Money Flow Index?
The Money Flow Index (MFI) is a momentum indicator used by traders to identify buying and selling pressure. It’s very similar to the Relative Strength Index, or RSI, but with one crucial difference. The MFI considers both price and volume, whereas RSI only takes price into account.
This makes the Money Flow Index a useful tool for traders who want more than an elementary momentum status report. It can help illustrate whether money is rushing in or out of an asset. In other words, it attempts to inform you whether buyers are taking charge, sellers are taking over, or momentum may be beginning to fade.
It ranges from 0 to 100. Traders often use it to spot:
- overbought conditions
- oversold conditions
- trend strength
- divergence between price and momentum
- possible reversal points
Why the Money Flow Index Matters
Price can tell you what the market is doing. Volume can help explain how strong that move may be. That is often considered relevant because not every price move is equal.
A sharp move on weak volume may not last. A breakout with strong volume may carry more weight. The Money Flow Index tries to capture that relationship.
For traders, this is sometimes used to explore questions such as:
- Are buyers truly in control?
- Is selling pressure increasing?
- Is momentum strong enough to support the move?
- Could the market be close to exhaustion?
Money Flow Index vs RSI
The Money Flow Index is often compared with the Relative Strength Index because both move between 0 and 100, and both are used to spot momentum extremes.
The key difference is this:
- RSI uses price
- MFI uses price and volume
Because of that, the MFI may give a fuller picture in markets where volume data is useful and reliable.
The table below summarises the key differences between MFI and RSI
| Feature | Money Flow Index (MFI) | Relative Strength Index (RSI) |
| Proof of Identity | Buying and selling pressure | Price momentum |
| Main inputs | Price and volume | Price only |
| Scale | 0 to 100 | 0 to 100 |
| Common overbought level | Above 80 | Above 70 |
| Common oversold level | Below 20 | Below 20 |
| Common use | Checking if price moves have volume support | Tracking speed and strength of price moves |
| Strength | Adds volume insight | Simple and easy to read |
| Limitation | Depends on volume data quality | Ignores volume |
How Traders Use the Money Flow Index
Traders commonly use the Money Flow Index in several practical ways. These include:
1. Confirming Trend Strength
The MFI can also be used to support trend analysis.
If the price is rising and the MFI is also moving upward, that may suggest the trend has genuine strength behind it or indicates high buying pressure. If the price is falling and the MFI is dropping as well, that may indicate selling pressure remains strong.
This may be considered useful by some traders because trends can appear healthy on the surface, even as momentum begins to fade. The MFI can sometimes reveal that shift sooner than price alone.
2. Spotting Divergence
One commonly observed way traders use the MFI is through divergence.. Bullish Divergence – This occurs when price makes a lower low while the MFI makes a higher low. That may suggest selling pressure is beginning to weaken, even though the price is still declining. Some traders treat this as an early clue that a reversal may develop.
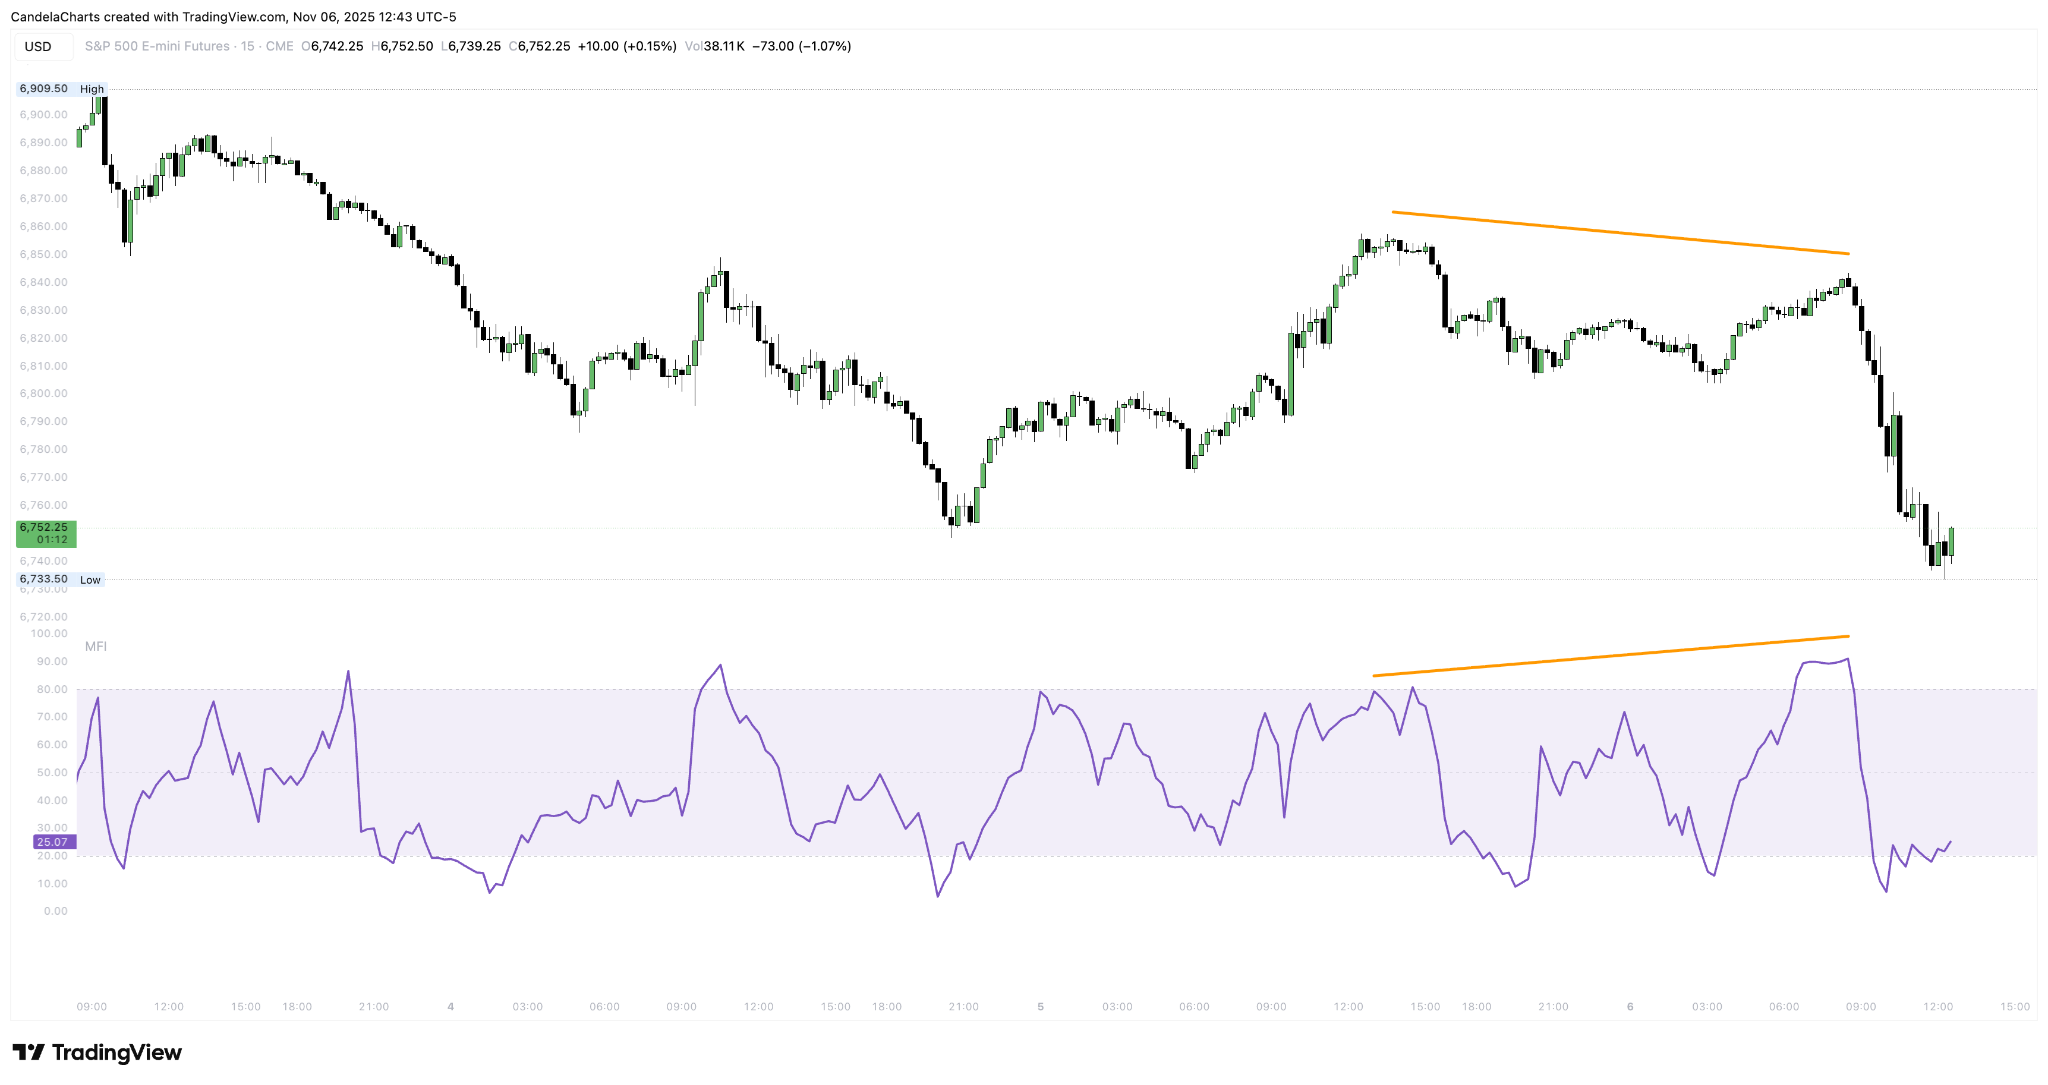
Bearish Divergence – This occurs when the price reaches a higher high while the MFI forms a lower high. That can signal weakening buying pressure during a price rise. Traders may see this as a warning that the upward move is losing strength.
Divergence should not be treated as a stand-alone entry signal. It is best used as part of a wider technical view. Divergence does not confirm that a reversal will occur and may produce false signals in certain market conditions.
3. Identify Overbought and Oversold Conditions
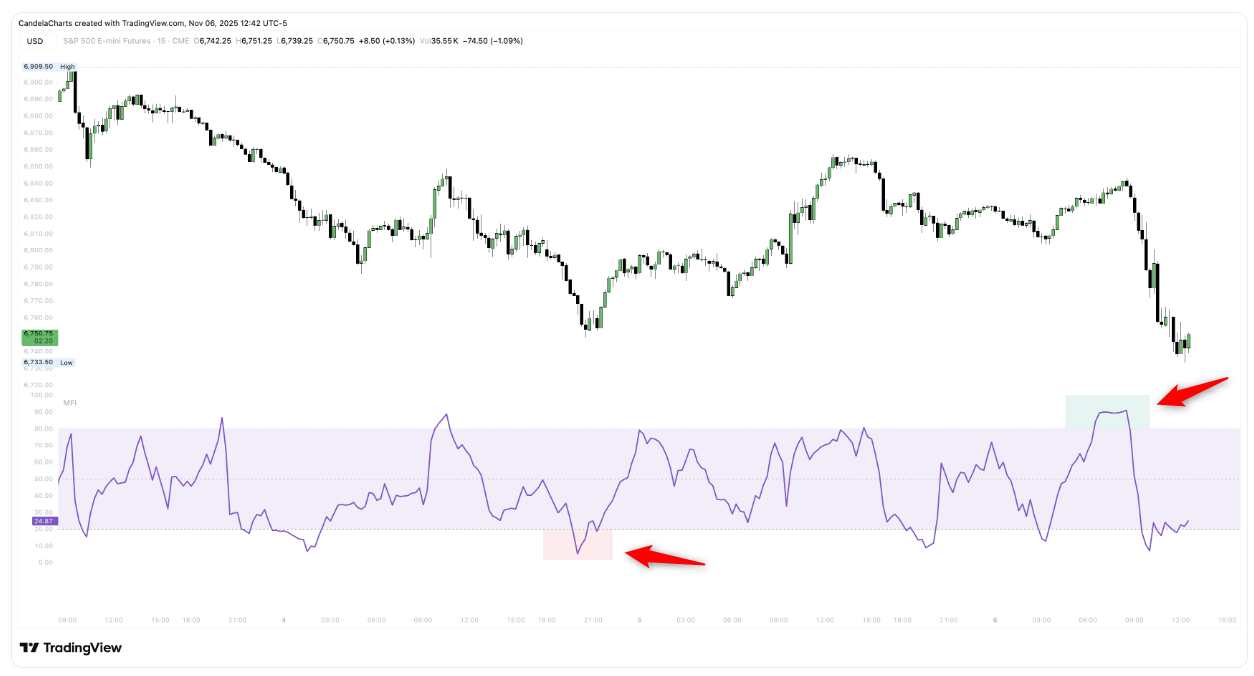
This is the most familiar use of the indicator. When the MFI rises above 80, traders may begin to suspect the market is overbought. When it falls below 20, they may see the market as oversold.
Still, experienced traders do not act on these readings alone. Some traders also consider additional context, such as:
- nearby support or resistance
- trend direction
- Reversal candlestick patterns
- weakness in price structure
- confirmation from another indicator
This approach may help traders filter signals, though no method eliminates uncertainty entirely.
How The Money Flow Index is Calculated
Here is how the Money Flow Index (MFI) is calculated:
1. Find the Typical Price
First, calculate the typical price for the period:
Typical Price = (High + Low + Close) ÷ 3
This gives a balanced view of the asset’s price for that session.
2. Calculate Raw Money Flow
Next, multiply the typical price by volume:
Raw Money Flow = Typical Price × Volume
This represents an estimate of the level of trading activity during that period.
3. Separate Positive and Negative Money Flow
If the current typical price (TPt) is higher than the previous period’s typical price(TPt-1), the raw money flow(MF) is counted as positive money flow (PMF)
If TPt > TPt-1, MF = PMF
- If the current typical price is lower, it is counted as negative money flow (NMF)
If TPt < TPt-1, MF = NMF
4. Calculate the Money Flow Ratio
Over a set period, usually 14 periods or days, divide the total positive money flow by the total negative money flow:
Money Flow Ratio = Positive Money Flow ÷ Negative Money Flow
MFR = PMF/NMF
5. Apply the MFI Formula
Finally, use this formula:
MFI = 100 – [100 ÷ (1 + Money Flow Ratio)]
This gives a value between 0 and 100.
What the Final Number Means
- A reading above 80 may suggest the asset is overbought
- A reading below 20 may suggest it is oversold
How to Read the Money Flow Index
As mentioned earlier, the MFI readings are on a scale from 0 to 100. It helps traders gauge whether buying or selling pressure is intensifying.
Here is how to read it:
1. Look at the Current Value
The first step is to check where the MFI sits on the scale.
- Above 80 often suggests the market is overbought
- Below 20 often suggests the market is oversold
- Around 50 usually points to a more neutral market
These levels help traders spot when the price may be stretched. Like all technical indicators, the Money Flow Index does not guarantee future price movements and should be interpreted with caution.
2. Watch the Direction
The MFI value matters, but the direction matters too.
- If the MFI is rising, buying pressure may be building
- If the MFI is falling, selling pressure may be increasing
This helps traders see whether momentum is strengthening or weakening.
3. Check for Divergence
Divergence happens when price and MFI move in different directions.
- Bullish divergence: price makes a lower low (LL), but MFI makes a higher low (HL). This can hint that selling pressure is fading
- Bearish divergence: price makes a higher high (HH), but MFI makes a lower high (LH). This can hint that buying pressure is weakening
Divergence is sometimes used as part of a broader analysis when considering possible changes in price direction. Interpretations can vary depending on market conditions.
4. Use It With Price Action
The MFI works best when read with the chart. For example:
- An overbought MFI near resistance is sometimes viewed by traders as additional context for a potential pullback
- An oversold MFI near support is sometimes viewed by traders as additional context for a potential bounce
This may provide additional context to the reading.
5. Avoid Reading It Alone
An MFI reading above 80 does not always mean the price will fall at once. A reading below 20 does not always mean the price will rise right away. Strong trends can stay overbought or oversold for some time.
That is why traders often use MFI with:
- support and resistance
- trend direction
- candlestick patterns
- other indicators
Benefits of Using the Money Flow Index
- Combines Price and volume: This is one of its main strengths. This may provide additional insight into the intensity of buying and selling pressure. This helps in understanding whether a substantial movement is supported by substantial market activity.
- Very easy to read: The scale ranges between 0 – 100, which makes it simple to spot when buying or selling pressure may be reaching an extreme.
- Flexibility: It works across markets and timeframes, which makes it useful for a wide range of trading styles. It can be applied to forex, stocks, commodities, indices, and other assets, whether a trader is focused on short-term setups or broader market trends.
- Identify shifts in momentum: When the MFI starts to rise or fall, it can signal a change in market pressure. This may assist traders in analyzing whether a trend is strengthening, weakening, or beginning to lose support.
Limitations of the Money Flow Index
While the MFI can be a useful analytical tool, it is not without limitations. Like any technical tool, it works best when traders understand both what it can do and where it can fall short. The following are ways it can mislead you;
1. Strong trends can pin MFI at extremes. MFI can remain overbought or oversold for longer than expected. In a strong uptrend, the indicator may stay above 80 for an extended period.
In a strong downtrend, it may remain below 20 for quite some time. This means traders should not assume that an extreme reading will lead to an immediate reversal.
2. Data irregularities: Since volume is part of the calculation, weak or incomplete data can affect the quality of the signal. This matters even more in markets where volume reporting may not be as clear or consistent.
3. The indicator can also struggle in choppy market conditions. When the price moves sideways without a clear trend, the MFI may swing back and forth too often. That can make its signals less reliable and harder to act on with confidence.
4. MFI is just one tool in the trader’s toolbox: On its own, it does not provide enough context to support strong trading decisions. It should be used with other trading indicators. Traders often combine it with price action, trend analysis, support and resistance, or other confirming tools.
Frequently Asked Questions
Is the Money Flow Index a reliable indicator?
It can be helpful when used with other forms of analysis. It is most effective as part of a broader trading process rather than as a stand-alone signal.
What does it mean when the MFI goes above 80?
A reading above 80 often suggests strong buying pressure and a market that may be overextended. It does not confirm that the price will reverse at once.
What does it mean when the MFI goes above 20?
A reading below 20 often points to strong selling pressure and a market that may be oversold. It should not be treated as an automatic buy signal.
Is the Money Flow Index suitable for beginners?
Yes. The concept is fairly easy to understand. The key is learning how to use it in a chart context rather than relying on it alone
Risk Warning: CFDs are complex financial instruments and carry a high risk of rapid loss of money due to leverage. You should ensure you fully understand the risks involved and carefully consider whether you can afford to take the high risk of losing your money before trading.
Disclaimer: The information is provided for educational purposes only and doesn’t take into account your personal objectives, financial circumstances, or needs. It does not constitute investment advice. We encourage you to seek independent advice if necessary. No representation or warranty is given as to the accuracy or completeness of any information contained within.
Disclaimer:This material may contain historical or past performance figures and should not be relied on. Furthermore, estimates, forward-looking statements, and forecasts cannot be guaranteed. The information on this site and the products and services offered are not intended for distribution to any person in any country or jurisdiction where such distribution or use would be contrary to local law or regulation.
References
- https://www.investopedia.com/terms/m/mfi.asp – Money Flow Index: Definition and Uses
- https://www.tradingview.com/chart/ES1!/KUI04s0 I-Understanding-Money-Flow-Index-In-Trading/ – Understanding Money Flow Index in Trading
- https://impakter.com/pros-and-cons-of-using-mfi-in-trading/ – What are The Pros and Cons of Using MFI in Trading
- https://www.quora.com/To-what-extent-can-the-money-flow-index-be-used-as-the-sole-indicator-of-the-trading-portfolio –
- https://vantagemarektsdev.canglankeji.com/en-za/academy/technical-indicators/ – What are Technical Indicators and Use
- https://www.investopedia.com/ask/answers/121214/what-are-main-differences-and-similarities-between-money-flow-index-mfi-relative-strength-index-rsi.asp – How MFI differs from RSI