
 Updated

One of the most popular technical analysis tools is the MACD indicator. Traders love it because it resolves two questions with one answer: How is the trend behaving, and is momentum strengthening or weakening?
Gerald Appel created this indicator in the late 1970s, which is based on exponential moving averages, making it a trend-following momentum tool rather than a pure timing tool.
It matters because many traders are not challenged by identifying price movement. They have issues reading the quality of the move. A market might be rising, but is that rise strong or weak, or getting near to fading? The MACD indicator provides a simple visual way to frame that question with a MACD line, a signal line, and a histogram.
Still, MACD should be used carefully. It is based on moving averages, so it reacts to price rather than predicts it. That means it can help confirm momentum and trend direction, but it can also give weak signals in choppy or sideways markets.
In this guide, you will learn
- Everything you need to know about moving averages.
- Formula to calculate MACD
- How to read the MACD indicator
- The main MACD signals that traders use.
- How to use MACD in a trading plan

What is the MACD indicator?
MACD stands for Moving Average Convergence Divergence. Readily available on many trading platforms, including those offered by CFD brokers, such as Vantage. It measures the gap between a short-term EMA and a longer-term EMA. The standard setup uses the difference between two Exponential Moving Averages (12-period minus 26-period) to create the MACD line.
A 9-period EMA of the MACD line then creates the signal line. The histogram shows the distance between those two lines.
When the shorter EMA moves away from the longer EMA, momentum is picking up. When the two move closer together, momentum slows. That is the core idea behind MACD. It is not just showing whether the price is going up or down. It is showing whether the force behind that move is rising or fading.
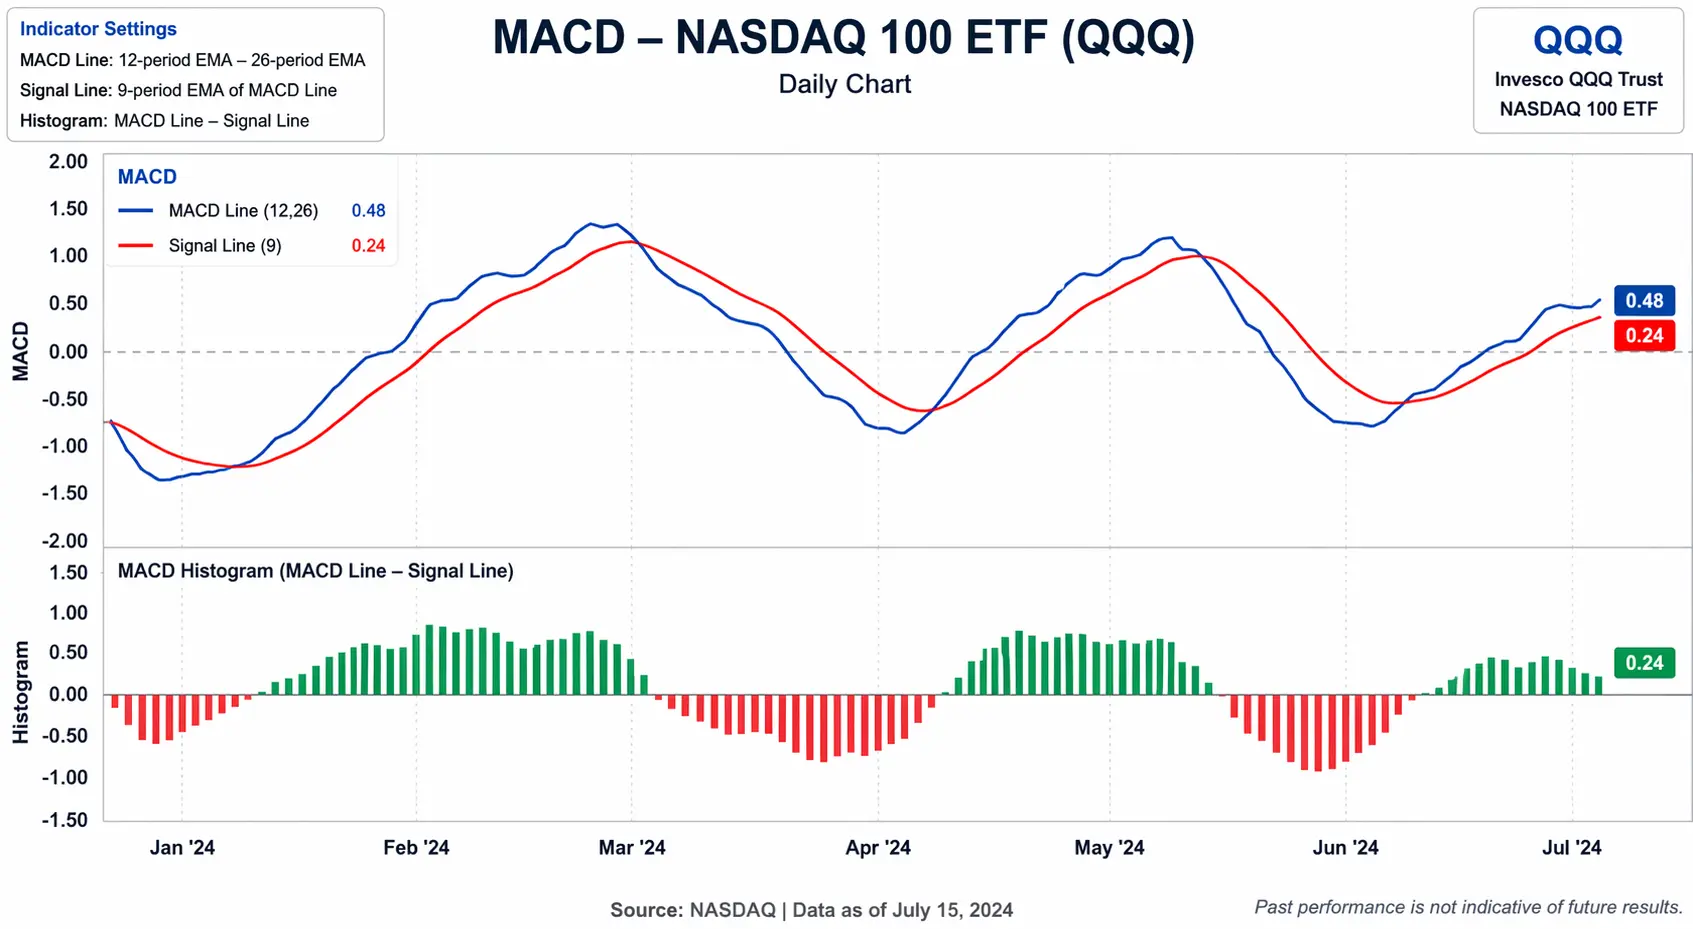
MACD Formula
To calculate MACD, we must identify its three components.
1. MACD Line
This is the first step in calculating and interpreting a MACD indicator. The MACD line is obtained from the result of subtracting the 26-period Exponential Moving Average from the 12-period Exponential Moving Average. If the value is above zero, the short-term EMA is above the long-term EMA, indicating upward momentum.
If the value is below zero, the short-term EMA is below the long-term EMA, which points to downward momentum
Mathematically;
MACD = 12- Period Exponential Moving Averages – 26 – Period Exponential Moving Averages.
2. Signal Line
This is the next step. The signal line is a 9-period EMA of the MACD line. Traders watch how the MACD line interacts with the signal line, as crossovers often suggest a shift in momentum. A move above the signal line is often interpreted by traders as a sign of strengthening upward momentum, while a move below it may suggest weakening momentum.
Therefore,
Signal Line = 9 days EMA of MACD Line
3. Histogram
This is the last step. It shows the distance between the MACD and signal lines. Positive bars mean the MACD line is above the signal line. Negative bars mean it is below. A growing histogram can signal rising momentum, while shrinking bars can signal that momentum is weakening before a crossover becomes obvious.
Histogram = MACD Line − Signal Line
Example
Assume the following values:
- 12-period EMA = 1.2050
- 26-period EMA = 1.2000
The MACD Line would be:
1.2050 − 1.2000 = 0.0050
If the 9-period EMA of the MACD line is 0.0035, then:
- Signal Line = 0.0035
- Histogram = 0.0050 (MACD Line) – 0.0035 (Signal Line) = 0.0015
This would suggest that upward momentum is still stronger than the signal line.
How To Read the MACD Indicator
In reading the MACD indicator, you have to watch how the parts interact. Also, it gets easier when you stop treating it like a single signal. It works best when you read it in layers (You can refer to the image above)
Step 1:Start with the zero line
The zero line is important because it provides a broad view of the trend’s direction.
- When MACD is above zero, short-term momentum is stronger than the longer-term average. This is often interpreted as supporting a bullish view.
- When MACD is below zero, short-term momentum is weaker than the longer-term average. This is often interpreted as supporting a bearish view.
This does not mean the price will move in one direction right away. It simply helps frame the market bias.
Step 2: Look for crossovers.
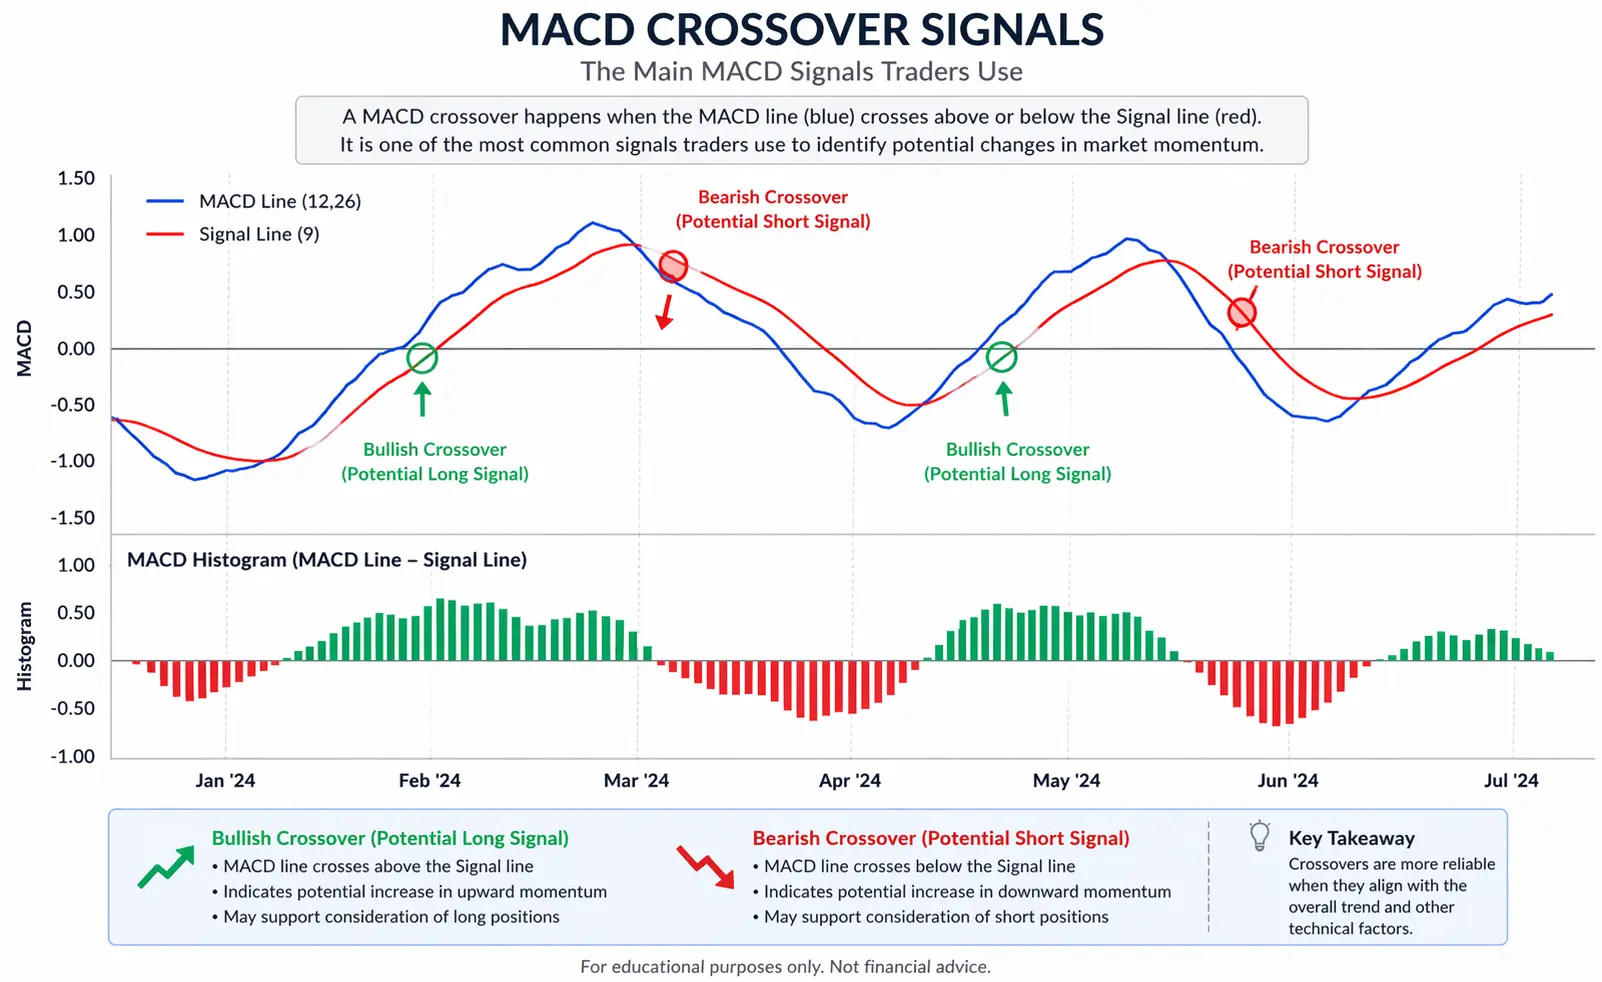
- A bullish crossover happens when the MACD line moves above the signal line.
- A bearish crossover happens when the MACD line moves below the signal line.
These crossovers are often interpreted by traders as potential shifts in momentum. Still, not every crossover leads to a clean move. Some happen in weak conditions and fail quickly.
Step 3: Read the Histogram
The histogram can add depth to your analysis. If positive bars continue to widen, momentum may be strengthening to the upside. If they start to shrink, buying pressure may be easing.
When negative bars grow larger, bearish force may be increasing. If they shrink, selling pressure may be slowing. This makes the histogram useful for spotting change before it becomes obvious on price alone.
The Main MACD Signals Traders Use
MACD is popular because it offers several clear signals that traders can use across different market conditions.
1. Signal line crossover
This is the most common MACD signal. It refers to a situation within the MACD line itself in which the MACD crosses above or below the signal line. Many traders monitor it as a potential signal within their analysis.
It is of two types.
A bullish crossover that may support a long trade. This crossover is usually seen as a positive signal. This may suggest that upward momentum is building, which some traders interpret as a potential long setup.
A bearish crossover, which may support a short trade. It may indicate a shift toward negative momentum, which some traders interpret as a potential change in market direction.
Still, the quality of the signal depends on context. A crossover that appears during a clear trend is often more useful than one that forms in a random sideways market.

2. Zero line crossover
A move above zero may be interpreted as the market shifting toward stronger bullish momentum. A zero line crossover occurs when the MACD line crosses the zero line, thereby changing sign. A move below zero may be interpreted as increasing bearish momentum i.e the change from positive to negative MACD. And the change from negative to positive is considered Bullish
This type of signal often appears after a signal line crossover and may be viewed by some traders as more significant because it reflects a larger shift in momentum. You can refer to the diagram above.
3. Divergence
Divergence happens when price and MACD stop moving in the same direction. For example:
- Price makes a higher high, but MACD makes a lower high
- Price makes a lower low, but MACD makes a higher low
This can warn that momentum is fading and that the current move may be losing strength.
Divergence can be valuable, but it should not be used alone. Markets can keep rising or falling for some time even after divergence appears.
4. Hidden divergence
Hidden divergence is less talked about, but still useful. It often points to trend continuation rather than reversal. This matters for traders who prefer to follow trends rather than try to catch tops and bottoms.
How To Use MACD in a Trading Plan
Different traders may interpret these signals differently, and no single indicator should be relied upon in isolation.
MACD becomes much more useful when it fits into a wider process. Traders often apply it within a broader analytical process, which may include:
1. Identify the market condition
Before looking for signals, decide whether the market is trending or ranging. MACD tends to perform better when the price is moving clearly in one direction. In a sideways market, crossovers can occur too often, creating false signals.
So the first question is not “What is MACD saying?” It is “What kind of market am I in?”
2. Check the higher timeframe
A higher timeframe can help set your bias. If the daily chart is trending up and MACD is above zero, some traders may look for long setups on lower timeframes. If the higher timeframe is bearish and MACD is below zero, some traders may place more emphasis on short setups.
This approach is often used to align analysis with the broader market trend.
3. Some traders look for clearer setups
Once the trend is clear, traders may look for potential triggers such as:
- a bullish crossover after a pullback in an uptrend
- a bearish crossover after a retracement in a downtrend
- a zero line break that supports a fresh shift in momentum
Some traders consider setups where MACD and price action align to be more structured.
4. Using price structure in risk management
MACD can help with timing, but it does not tell you where to place a stop-loss. That should come from the chart itself. Commonly referenced approaches include:
- recent swing highs or swing lows
- support and resistance
- invalidation levels
This is important because no indicator can replace proper risk control.
5. Managing trades with a broader context
As the trade develops, MACD can be used to assess whether momentum appears to be strengthening or weakening. A shrinking histogram may show that momentum is slowing. A crossover in the opposite direction may be interpreted as a potential shift in momentum.
Still, MACD should support the trade decision, not fully control it. Price structure remains the main guide.
A Practical Example
Imagine a market that has been trending upward. On the higher timeframe, MACD is above zero, which supports a bullish view.
Price then pulls back briefly. During that pullback, the histogram narrows, indicating that momentum has cooled. Soon after, the MACD line crosses back above the signal line while the price breaks above a recent swing high.
Some traders may view this type of setup as more structured because it combines:
- a clear trend
- a pullback
- a fresh momentum shift
- price confirmation
Now compare that to a market moving sideways in a tight range. MACD repeatedly crosses above and below the signal line, but the price does not break into a real trend. In that case, MACD is not the problem. The market simply isn’t providing the right environment.
Best Ways to Combine MACD with Other Tools
MACD works best when it is used with simple chart tools rather than stacked with too many indicators. Useful companions include:
- Support and resistance
- Trendlines
- Moving averages
- Swing highs and lows
- Candlestick structure
The goal is not to collect more signals. These tools are often used together to provide additional context. For example, a bullish MACD crossover near support in an uptrend may be interpreted differently compared to the same crossover in the middle of a range. A bearish crossover near resistance in a downtrend may also be interpreted as more significant by some traders.
In trading, context always matters more than one signal.
Common MACD Trading Mistakes
- Changing settings without a reason: The standard MACD settings of 12, 26, and 9 are widely used, and they can be adjusted to fit a trading style. That said, changing settings without testing can make the indicator too slow or too sensitive. A faster setup may give earlier signals, but it can also raise noise. A slower setup may filter noise, but it may react too late.
- Ignoring price action: Price is still the main source of truth. Investopedia stresses that price action should guide decisions when using divergence, and that traders should wait for the market to confirm a break in trend before acting. MACD is most useful when it supports what price is already showing.
- Using divergence as a timing signal: Many traders see divergence and assume the price must reverse soon. Investopedia warns that divergence can create false positives and may appear long before any actual reversal happens. In some cases, the price keeps trending for a long time after a divergence appears. That makes divergence a better caution sign than a direct entry trigger.
- Treating every crossover as a trade: This is one of the biggest mistakes. A crossover inside a messy range is not the same as a crossover after a pullback in a strong trend. Traders who ignore market context often get chopped up because they treat all signals as equal.
Pros And Cons Of MACD
| Pros of MACD | Cons of MACD |
| Easy to read on most charts | Can give false signals in sideways markets |
| Shows both trend and momentum | It is a lagging indicator |
| Helps spot crossovers and momentum shifts | Signals may come late |
| Useful for finding possible trend reversals | Divergence does not always lead to a reversal |
| Works well with other tools like support and resistance | Should not be used alone |
| Good for beginners and experienced traders | Can look confusing at first |
Frequently Asked Questions
How do traders read the MACD indicator?
Traders read MACD by looking at the MACD line, the signal line, and the histogram. They watch for crossovers, shifts above or below zero, and changes in histogram bars to judge momentum.
What is a bullish MACD crossover?
A bullish crossover happens when the MACD line moves above the signal line. This often suggests that upward momentum may be building.
Why are the standard MACD settings 12, 26, and 9?
The 12, 26, 9 setting is the most common default setup. In this format, 12 is the fast-moving average, 26 is the slow-moving average, and 9 is the signal line average. It is widely used because it provides a balanced view of momentum without being too fast or too slow.
What does it mean when MACD is below zero?
When MACD is below zero, it means short-term price action is weaker than the longer-term average. This often points to bearish momentum.
Is MACD a leading or lagging indicator?
MACD is a lagging indicator. It is based on historical price data, so it helps confirm market moves rather than predict them in advance.
Can MACD be used in day trading?
Yes, MACD can be used for day trading. It can also be used on swing trading and longer-term charts. Still, lower timeframes often produce more noise.
Does MACD work well in all market conditions?
Yes, MACD can be used for day trading. It can also be used on swing trading and longer-term charts. Still, lower timeframes often produce more noise.
Should MACD be used on its own?
MACD is often used alongside other tools rather than in isolation. Traders often combine it with price action, support and resistance, or trend structure for better decisions.
What is MACD divergence?
MACD divergence occurs when price moves in one direction while the MACD diverges. This can suggest that momentum is weakening, even if the price is still moving higher or lower.
What does the MACD histogram tell you?
The histogram shows the gap between the MACD line and the signal line. Bigger bars can suggest stronger momentum, while smaller bars may show that momentum is fading.
Is MACD good for beginners?
MACD is often seen as beginner-friendly because it is visual and easy to follow. Even so, beginners should learn how to use it with proper risk control and chart context.
RISK WARNING: CFDs are complex financial instruments and carry a high risk of losing money rapidly due to leverage. You should ensure you fully understand the risks involved and carefully consider whether you can afford to take the high risk of losing your money before trading.
Disclaimer: The information is provided for educational purposes only and doesn’t take into account your personal objectives, financial circumstances, or needs. It does not constitute investment advice. We encourage you to seek independent advice if necessary. The information has not been prepared in accordance with legal requirements designed to promote the independence of investment research.
No representation or warranty is given as to the accuracy or completeness of any information contained within. This material may contain historical or past performance figures and should not be relied on. Furthermore, estimates, forward-looking statements, and forecasts cannot be guaranteed. The information on this site and the products and services offered are not intended for distribution to any person in any country or jurisdiction where such distribution or use would be contrary to local law or regulation.
Reference
- https://www.investopedia.com/terms/m/macd.asp – What is the MACD indicator?
- https://www.tradingview.com/support/solutions/43000502344-moving-average-convergence-divergence-macd-indicator/ – MACD Indicator
- https://www.linkedin.com/pulse/signal-line-crossover-powerful-tool-technical-analysis-akash-panchal-uqouf/ – Signal line crossover analysis
- https://vantagemarektsdev.canglankeji.com/en-za/academy/best-trading-indicators/ – Best Trading Indicators for 2026
- https://corporatefinanceinstitute.com/resources/career-map/sell-side/capital-markets/macd-oscillator-technical-analysis/ – MACD Oscillator: Technical Analysis
- https://www.tradingview.com/chart/GBPUSD/B7c09Qug-Mastering-MACD-Complete-Guide-10-ways-to-trade-it/ – Mastering MACD – 10 Ways To Trade It