Updated
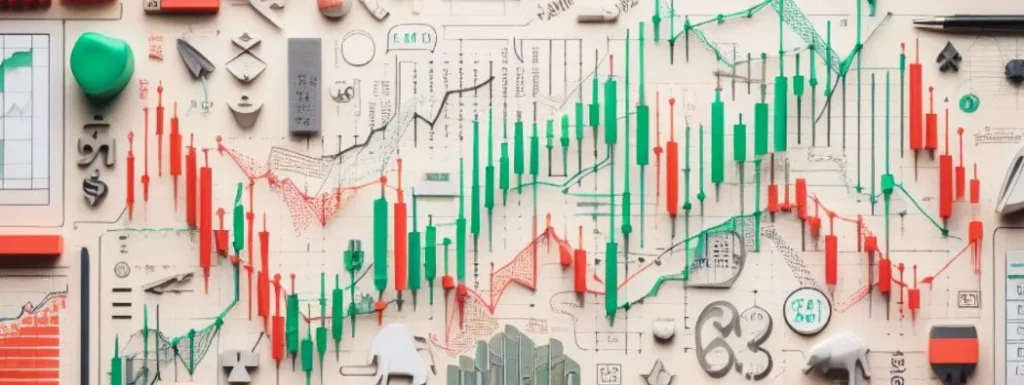
Candlestick charts are among the most widely used tools in technical analysis, offering traders a clear, concise way to interpret price movements over specific time intervals. Each candlestick captures four key data points: the open, high, low, and close, providing valuable insight into market behaviour within that period.
By studying the shapes and formations of candlestick patterns, traders can gauge market sentiment, identify potential reversals or continuations, and make more informed trading decisions. Whether you’re trading forex, stocks, or commodities, understanding candlestick charts can enhance your ability to analyse price action and refine your strategy.
In this guide, we’ll explore 16 essential candlestick charts every trader should know—and how to apply them effectively in real-world market conditions.
Key Points
- Candlestick charts visually represent price action by showing an asset’s open, high, low, and close within a specific timeframe.
- Recognising key candlestick patterns helps traders anticipate market reversals, continuations, and shifts in sentiment.
- Learning how to interpret candlestick charts is essential for building a solid technical trading strategy across various markets.
What are Candlesticks in Trading?
Candlesticks are a key trading tool that represent an asset’s price movements over a specific time period. Each candlestick displays four essential pieces of information:
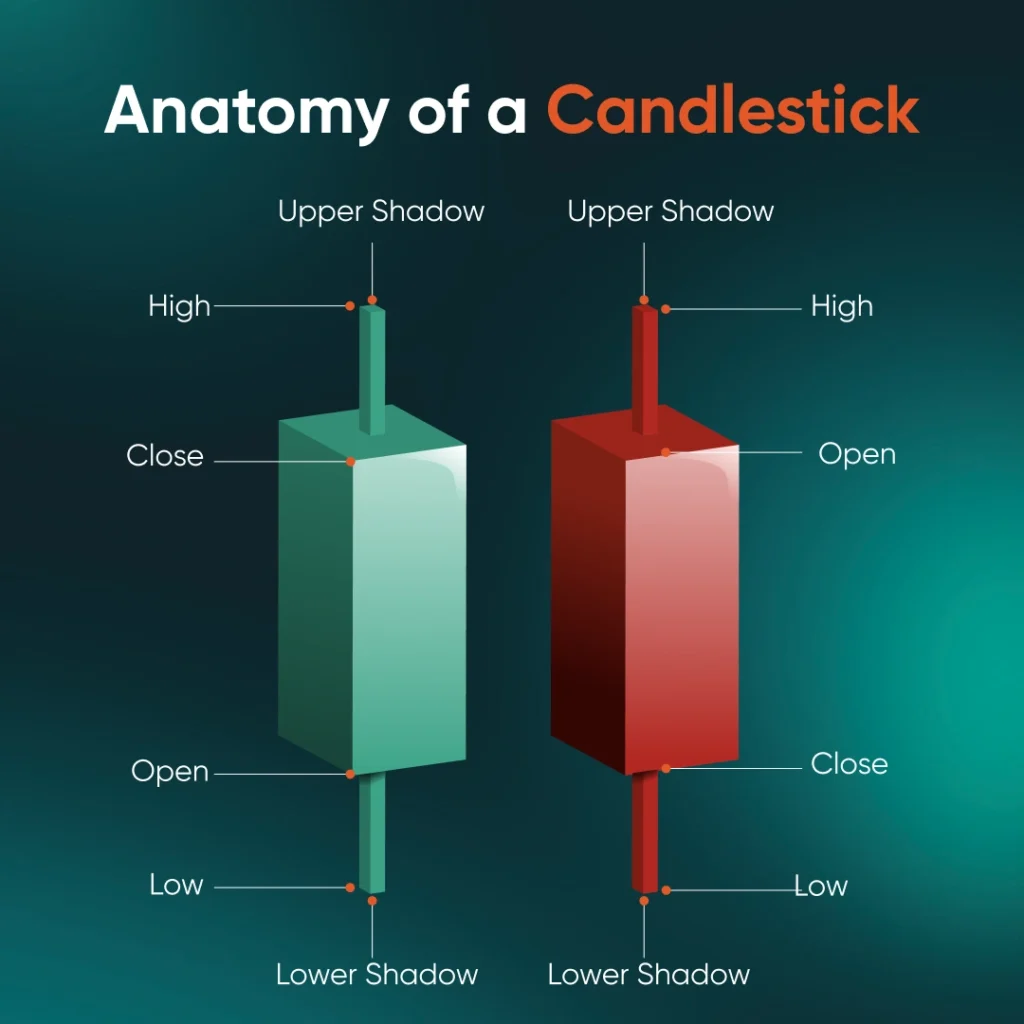
Open: The open is the price of an asset at the start of the trading period, showing where the market begins. It provides a baseline for comparison with the close to determine whether the price rose or fell.
Close: The close is the final price of an asset at the end of the trading period. It is a key indicator of market sentiment and is compared with the open to assess if the market ended higher (bullish) or lower (bearish).
High: The high represents the maximum price the asset reached during the trading period. It reflects the strongest point of buyer interest before the price retraces.
Low: The low is the minimum price the asset reached within the trading period. It shows the lowest point of selling pressure before the price rebounded.
With all this information derived from one humble candlestick, do not underestimate the value of using candlesticks in your trading as each candlestick tells a certain story.
Why Use Candlestick Charts
Candlestick charts are widely used by traders because they provide a clear visual representation of price movements within a specific period. One key advantage of candlesticks is that they offer more detail than simple line charts, allowing traders to quickly grasp market sentiment and identify potential trends.
The distinct shapes, colours, and patterns formed by candlesticks provide deeper insights into whether an asset is in a bullish or bearish trend, helping traders refine both their short-term and long-term strategies.
Additionally, candlestick charts can reveal important reversal or continuation patterns that may not be easy to spot using other chart types. By recognising these patterns, traders can make more informed decisions about when to enter or exit a trade and potentially capitalise on market opportunities.
How to Read Candlestick Charts
Interpreting candlestick charts is key to understanding market sentiment.
A bullish candle indicates the price closed higher than it opened, signalling buyer dominance and an upward trend. This is typically represented by a green candle.
In contrast, a bearish candle shows that the price closed lower than it opened, reflecting stronger selling pressure and a downward trend. This is usually represented by a red candle.
Beyond colour, the size of the candlestick body and its wicks (or shadows) offer deeper insights:
- A long body reflects strong buying or selling activity, confirming a decisive market move.
- A short body suggests market indecision or minimal price change during the session.
- Long upper or lower wicks may indicate price rejection at those levels, pointing to possible reversals or weakening trends.
As you continue reading, we’ll explore the most common candlestick patterns and how traders use them to make informed decisions.
Bullish Candlestick Patterns
Bullish candlestick patterns are formations on a candlestick chart that suggest a potential reversal from a downtrend to an uptrend. These patterns signal growing buying pressure and are commonly used by traders to identify entry points in a bullish market setup.
Hammer
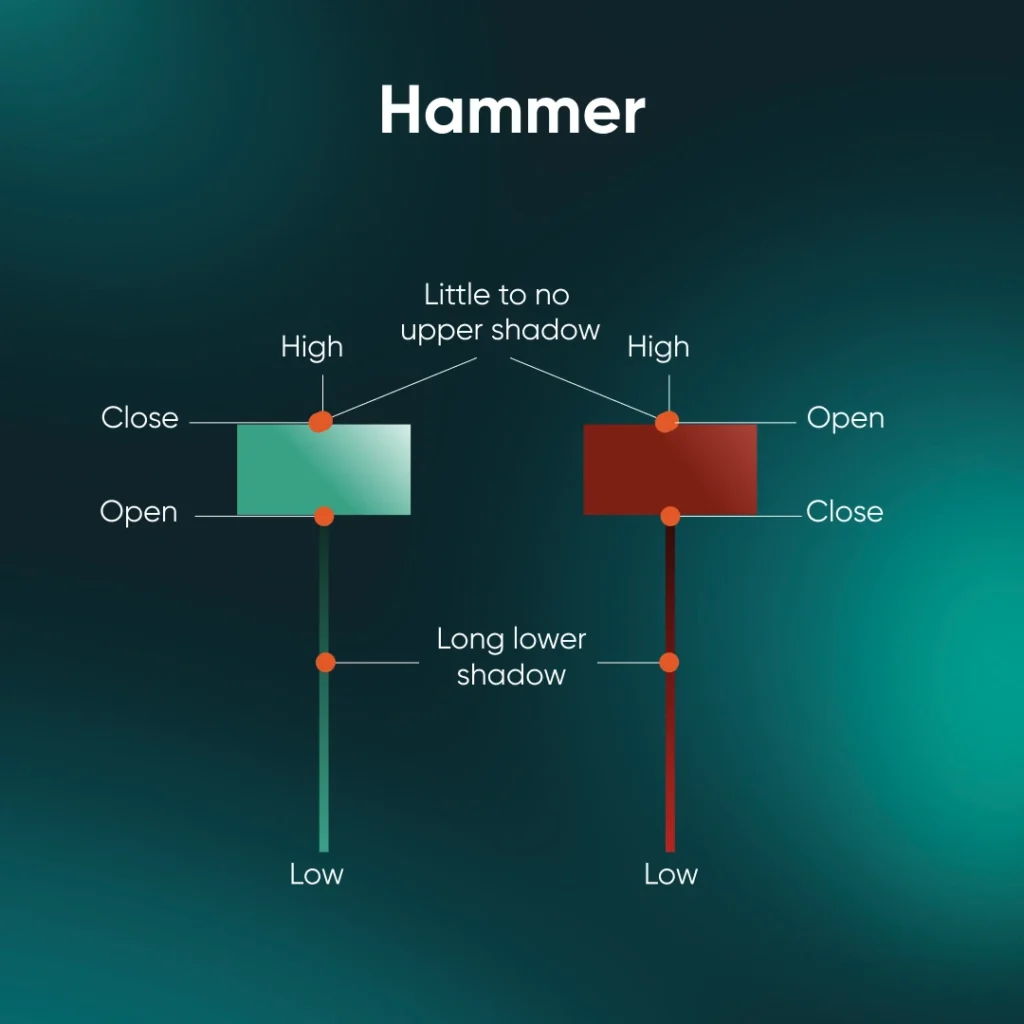
The hammer is a single-candle bullish reversal pattern that forms after a downtrend. It has a short body near the top and a long lower wick, showing that although sellers initially pushed the price down, buyers regained control by the close.
Pattern Characteristics:
- Appears at the bottom of a downtrend
- Small body, long lower shadow
- Signals buyer strength returning
- Common in reversal trading strategies
Inverse Hammer
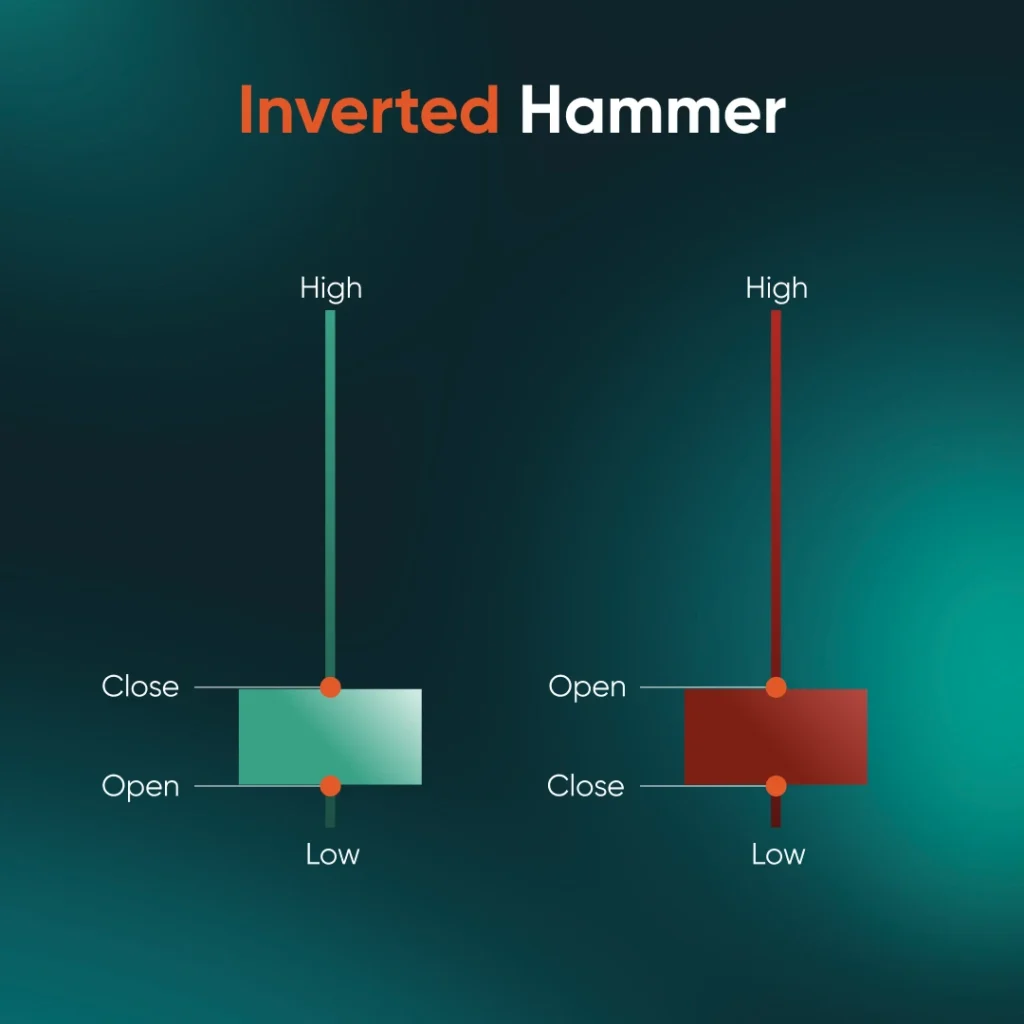
The inverse hammer also forms after a downtrend but has a long upper wick and a small body near the base. It reflects early buying interest, though confirmation from the next bullish candle is usually required to validate the pattern.
Pattern Characteristics:
- Occurs during a downtrend
- Small body with long upper shadow
- Indicates potential bullish reversal
- Requires follow-up confirmation
Bullish Engulfing
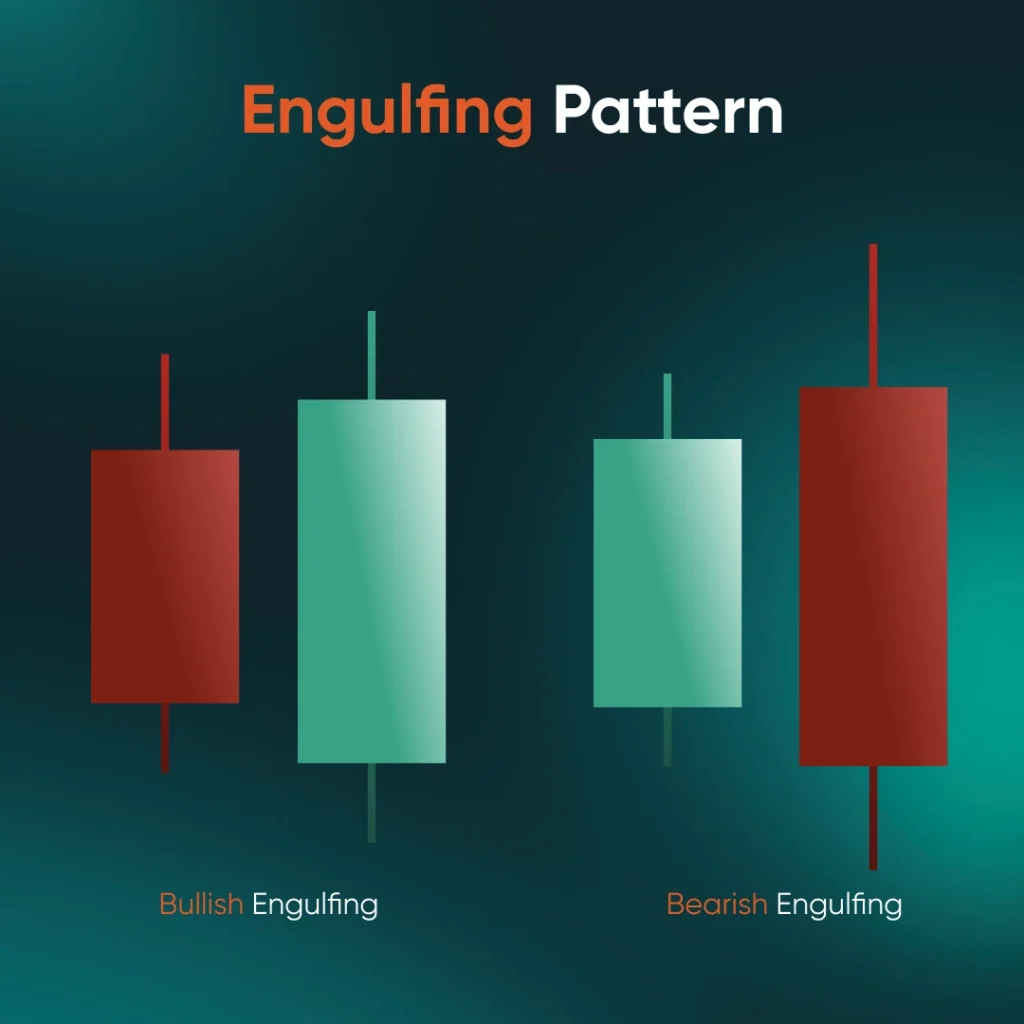
The bullish engulfing pattern consists of two candles. The first is a small bearish candle, followed by a larger bullish candle that completely covers or ‘engulfs’ the previous body. This shows a decisive shift from selling to buying momentum.
Pattern Characteristics:
- Two-candle reversal pattern
- Second candle engulfs the first
- Appears after a downtrend
- Strong sign of a shift in sentiment
Three White Soldiers
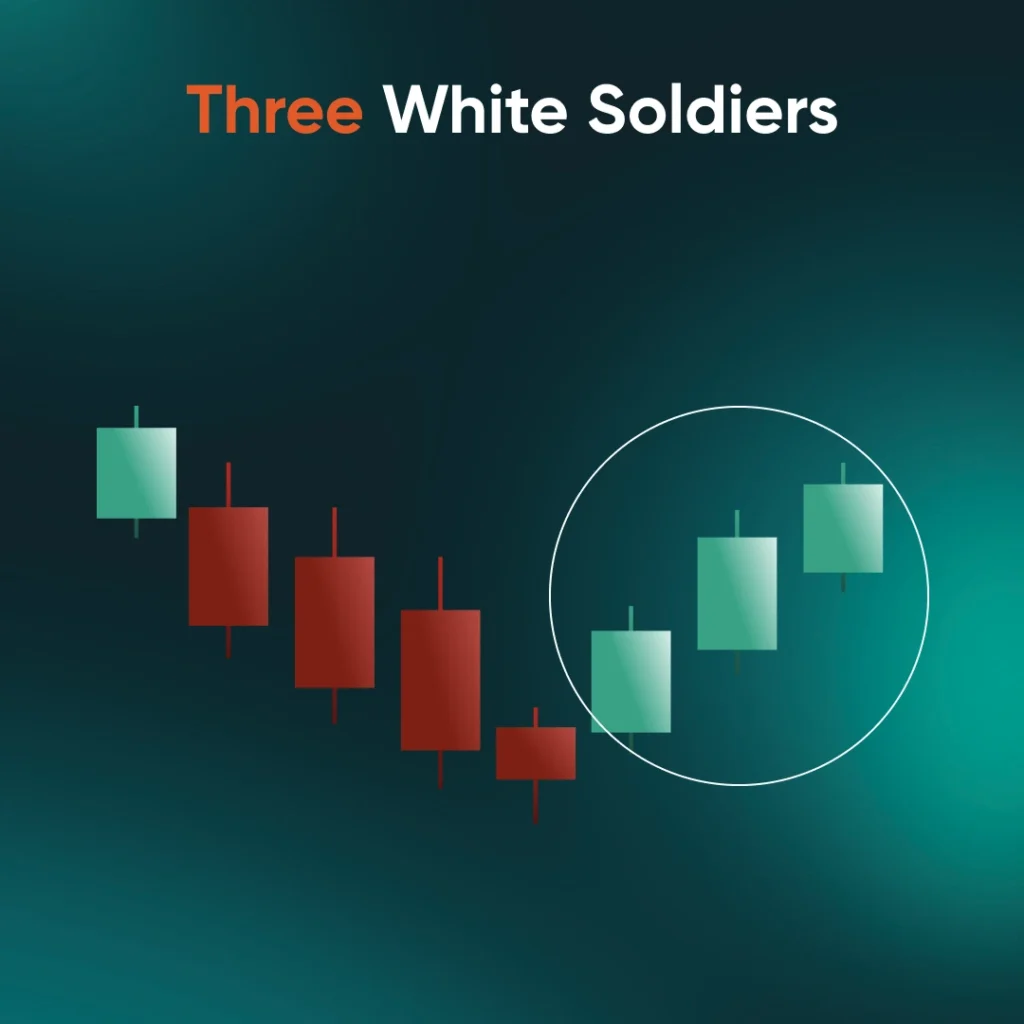
This pattern features three strong bullish candles forming consecutively, each closing higher than the last. It represents sustained buying momentum and is considered one of the more reliable bullish candlestick patterns.
Pattern Characteristics:
- Three consecutive green candles
- Higher closes with little wick shadows
- Indicates strong upward momentum
- Suggests potential trend reversal or continuation
Piercing Line
The piercing line is a two-candle formation. It starts with a long bearish candle, followed by a bullish candle that opens lower but closes above the midpoint of the first. It signals buying strength entering the market.
Pattern Characteristics:
- Found after a price drop
- Bullish candle closes above 50% of previous candle
- Suggests market recovery
- Early indicator of a bullish shift
Morning Star
The morning star is a three-candle bullish reversal pattern. It begins with a bearish candle, followed by a small-bodied candle that signals indecision, and ends with a strong bullish candle. Together, they indicate weakening selling pressure and growing buyer confidence.
Pattern Characteristics:
- Three-candle reversal setup
- Forms after a downtrend
- Centre candle shows hesitation
- Often confirms a new bullish trend
Marubozu
A bullish marubozu is a single, full-bodied candle with no visible wicks. It opens at the low and closes at the high, reflecting total buyer control during the session. It’s a strong signal of continued bullish momentum.
Pattern Characteristics:
- No wicks, just a solid green body
- Strong confirmation of buyer dominance
- Common in breakout strategies
- Indicates confidence in price rise
Dragonfly Doji
The dragonfly doji appears when the open, close, and high prices are nearly the same, with a long lower shadow. This suggests sellers had the upper hand early on, but buyers pushed the price back up, showing signs of a potential reversal.
Pattern Characteristics:
- Long lower wick, flat top
- Indicates rejection of lower prices
- Signals shift in momentum
- Watch for confirmation candle after
Bearish Candlestick Patterns
Bearish candlestick patterns are chart signals that suggest a potential shift from an uptrend to a downtrend. These formations often appear at the top of price movements and are widely used by traders to anticipate selling pressure and identify potential exit or short-selling opportunities.
Bearish Engulfing
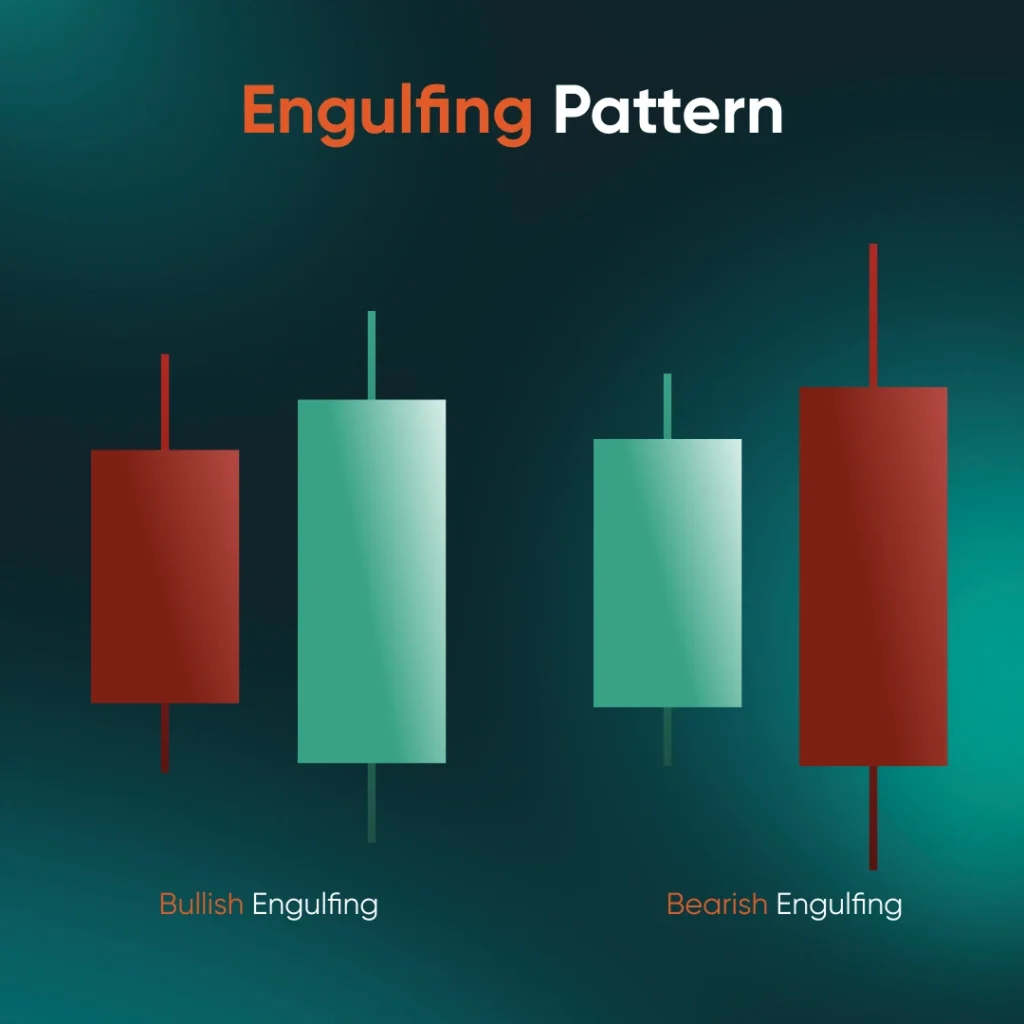
The bearish engulfing is a two-candle reversal pattern that appears after an uptrend. It forms when a small bullish candle is followed by a larger bearish candle that completely covers the previous candle’s body, signalling a strong shift in momentum from buyers to sellers.
Pattern Characteristics:
- Appears after an uptrend
- Bearish candle fully engulfs the prior bullish body
- Indicates rising selling momentum
- Suggests potential trend reversal
Morning Star
While commonly known as a bullish pattern, the morning star has a bearish counterpart—appearing as a three-candle formation at the top of an uptrend. It consists of a bullish candle, a small-bodied candle showing indecision, and a strong bearish candle, signalling a potential reversal.
Pattern Characteristics:
- Three-candle setup
- Occurs after an uptrend
- Signals weakening buyer strength
- Confirms bearish shift when followed by downward price action
Hanging Man
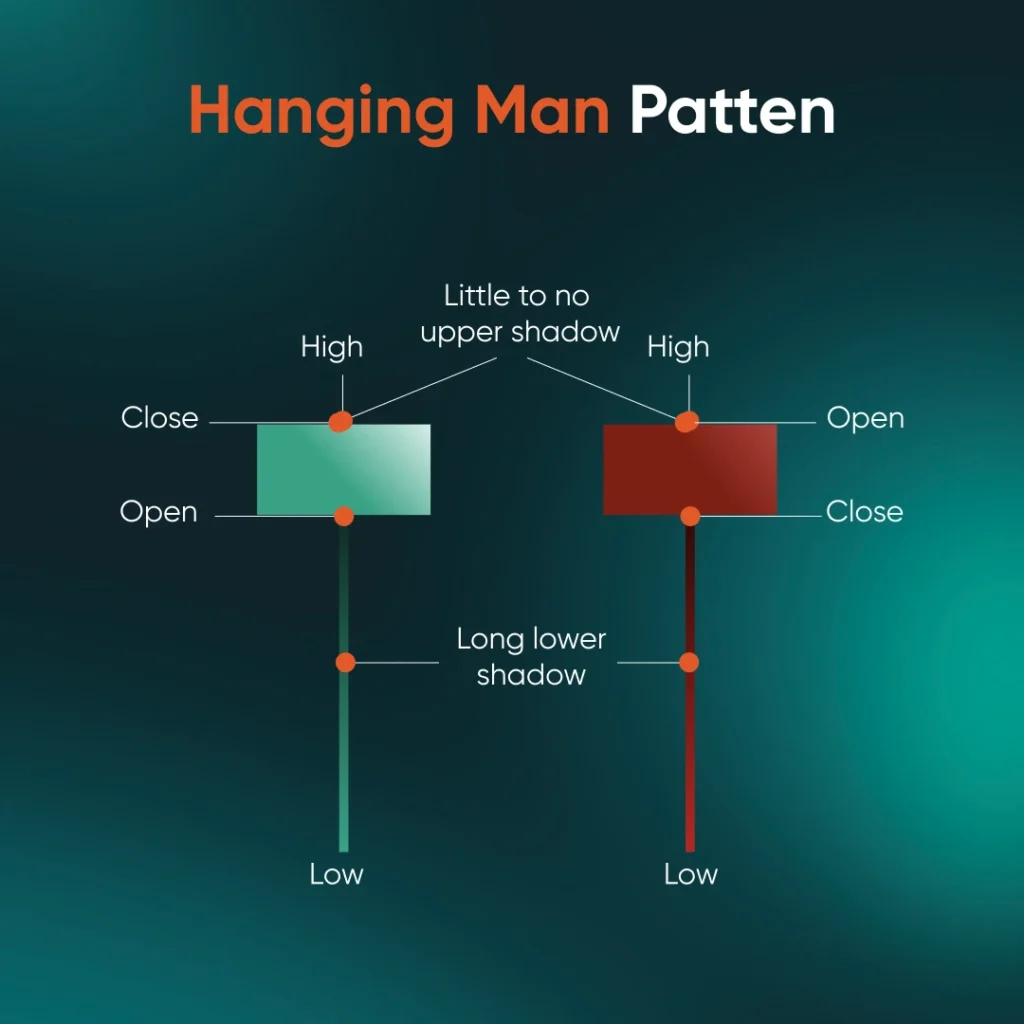
The hanging man is a single-candle bearish pattern found at the peak of an uptrend. Its small real body and long lower shadow suggest that selling pressure is emerging even as the price attempts to rise.
Pattern Characteristics:
- Forms after a price rise
- Small body, long lower wick
- Resembles a hammer but signals bearishness
- Often needs confirmation from the next candle
Shooting Star
A shooting star appears at the top of an uptrend and signals a potential reversal. It features a small real body near the bottom and a long upper wick, indicating that buyers pushed prices up, but sellers regained control by the close.
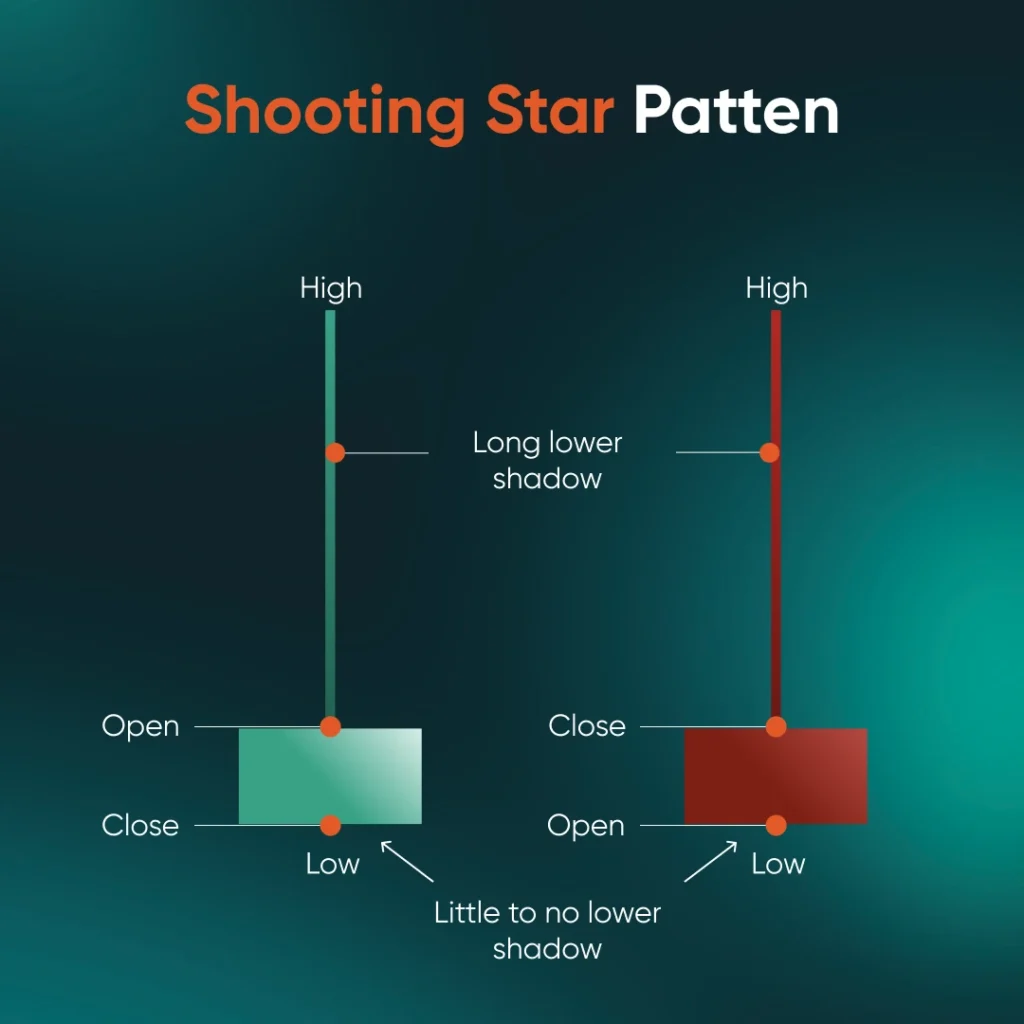
Pattern Characteristics:
- Appears in an uptrend
- Long upper shadow, small body below
- Suggests rejection of higher prices
- Implies possible price decline ahead
Three Black Crows
This pattern consists of three consecutive long bearish candles, each closing lower than the last. It shows a strong reversal from bullish to bearish sentiment, often confirming a developing downtrend.
Pattern Characteristics:
- Three strong red candles in a row
- Little to no lower wicks
- Each closes lower than the previous
- Indicates strong and sustained selling pressure
Dark Cloud Cover
The dark cloud cover is a two-candle bearish reversal pattern that appears after an uptrend. It starts with a strong bullish candle, followed by a bearish candle that opens higher but closes below the midpoint of the first. This pattern signals weakening buying pressure and a potential shift towards a downtrend.
Pattern Characteristics:
- Two candles: bullish then bearish
- Bearish candle closes below the midpoint of the bullish
- Appears after an uptrend
- Signals a potential shift to downside momentum
Bearish Harami
The bearish harami features a large bullish candle followed by a smaller bearish candle that is completely contained within the body of the previous one. It reflects waning buying pressure and potential market hesitation at the top.
Pattern Characteristics:
- Two-candle pattern
- Small bearish candle inside larger bullish body
- Indicates weakening bullish momentum
- Requires confirmation for a stronger signal
Marubozu
A bearish marubozu is a long red candle with no upper or lower shadows, meaning the price opened at the high and closed at the low. It shows strong selling pressure throughout the session and often signals the beginning or continuation of a downward trend.
Pattern Characteristics:
- Long bearish body with no shadows
- Opens at the high and closes at the low
- Reflects strong seller control
- Useful for confirming trend direction
Candlestick Chart Tool
Beyond the patterns mentioned, traders can use other candlestick chart tools to support their trades.
Technical Insights
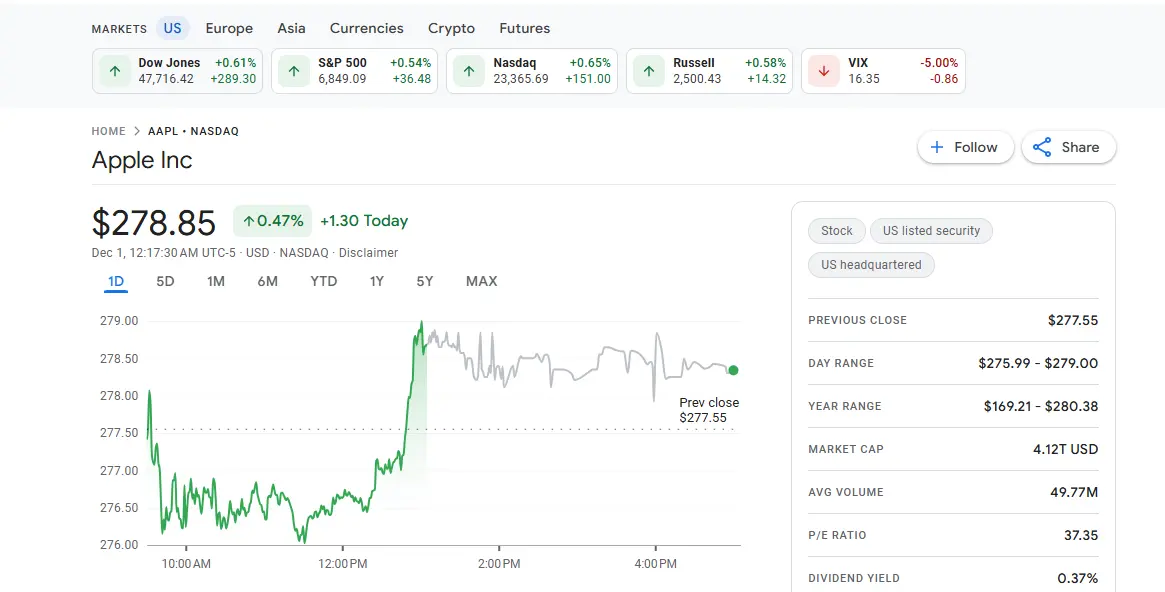
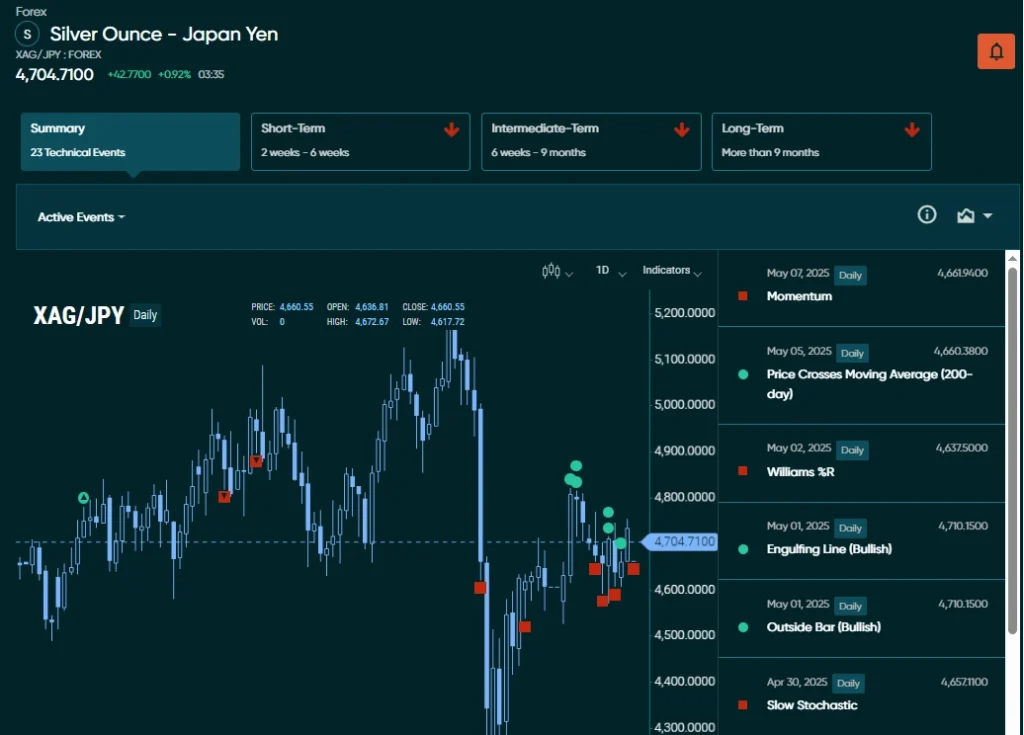
The Technical Insights feature available through Vantage WebTrader Tools provides traders with automated, real-time analysis of key chart patterns across major and minor forex pairs, as well as popular commodities. By leveraging advanced technical algorithms, this tool identifies price action signals, such as breakouts, trend reversals, and continuation patterns, helping traders make more informed decisions without constant manual chart monitoring.
Whether you’re trading gold, oil, EUR/USD, or exotic pairs like XAG/JPY, Technical Insights highlights relevant chart events and explains their potential impact, complete with visual overlays and historical context. This tool is particularly useful for traders who rely on technical analysis but value efficiency and timely alerts.
Featured Idea
The Featured Idea tool presents curated trading concepts built on proven strategies, combining both technical and fundamental analysis. These ideas are often illustrated through candlestick charts, giving traders a clear visual representation of price action and potential entry points.
Whether you’re trading major forex pairs like EUR/USD, USD/JPY, or AUD/USD, you can filter trade ideas based on your preferred forex pairs and analysis style.
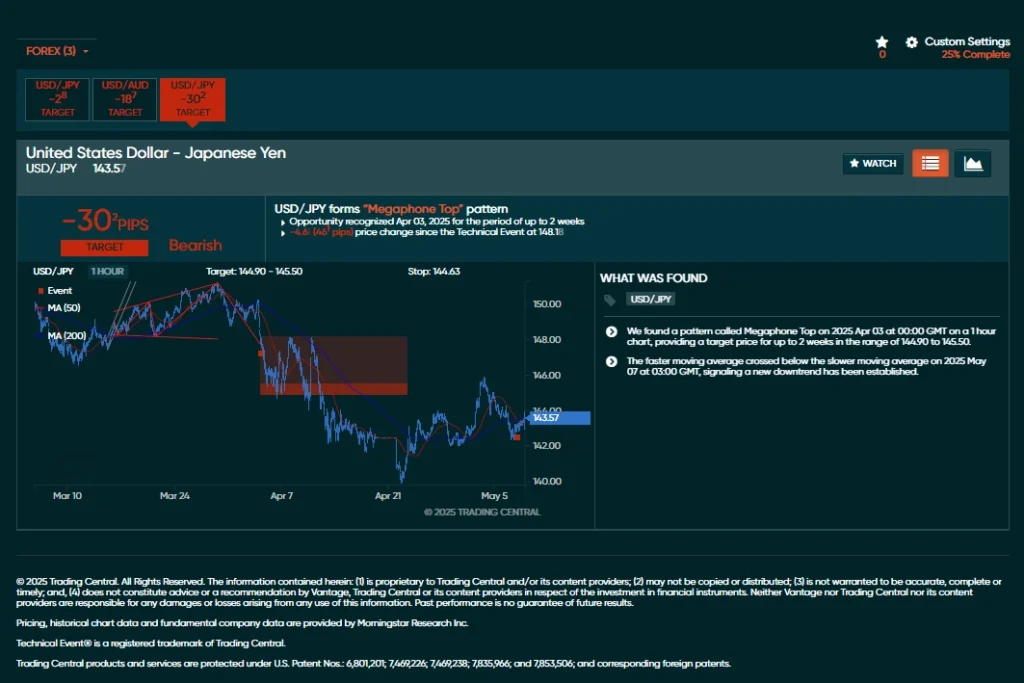
Image 11: Vantage Featured Idea
Analyst View
The Analyst View feature provides structured trading insights by combining quantitative models with expert-driven technical analysis. It covers a broad range of financial instruments and presents information through clearly defined trendlines, support and resistance levels, and candlestick chart tools.
This candlestick tool helps traders interpret market conditions more effectively by visually representing key technical indicators within a consistent analytical framework.
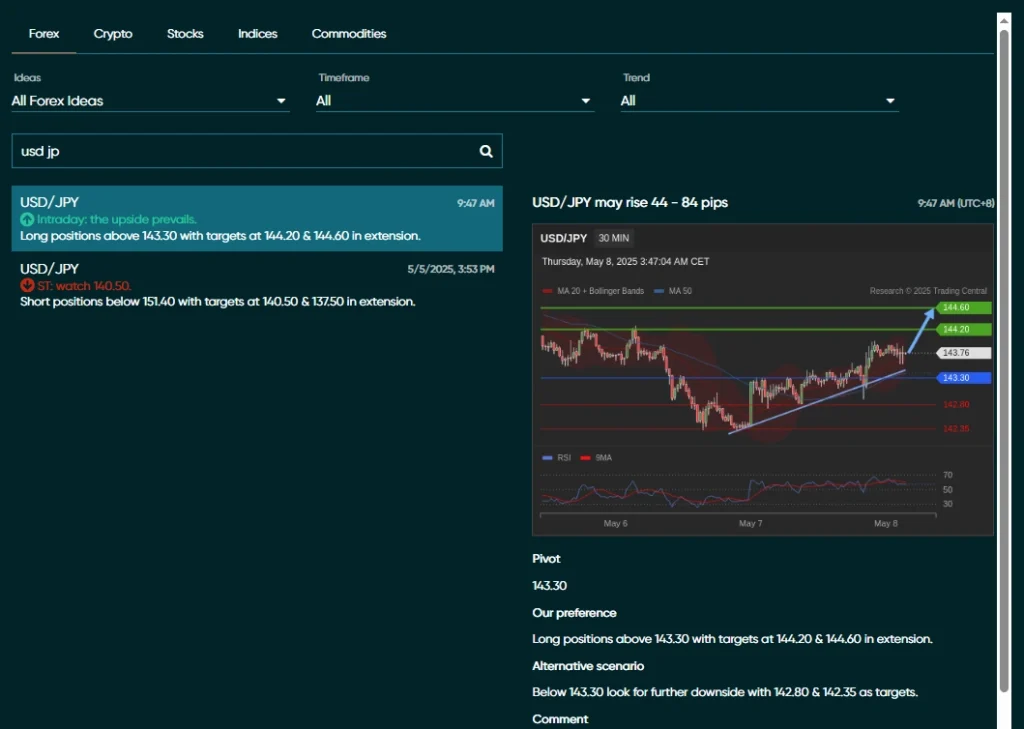
Image 12: Vantage Analyst View
Ready to explore these powerful candlestick chart tools? Open a Vantage live account today and start accessing expert analysis and real-time trading insights.
The Power of Candlestick Analysis in Your Trading Journey
Candlestick analysis is a vital tool for traders who need to decipher market sentiment and identify potential trends effectively. It visually represents price movements, offering insights into the open, high, low, and close values within a specific period.
By integrating these patterns with other technical indicators like RSI and moving averages, traders can obtain more reliable signals and refine their trading strategies. This comprehensive approach not only helps you make informed decisions but also supports better risk management.
Ready to unlock the full potential of candlestick analysis in your trading? Sign up for a live trading account today with Vantage today.